2. Classical ML and NLP
What is Classical Machine Learning?
In this bootcamp, when we refer to Classical Machine Learning Algorithms, we simply mean algorithms that are not based on Deep Learning or Neural Network based learning methods. These algorithms have been used for decades, far before the current hype of Machine Learning and Artificial Intelligence .
Some examples of Classical Machine Learning Algorithms include but are not limited to:
Supervised Learning: Naive Bayes, Linear Regression, Logistic Regression, Ridge Regression, K Nearest Neighbors, Support Vector Machine
Unsupervised Learning: Mean-shift, DBSCAN, K-Means
Info
DEFINITION DETOUR: Unsupervised and Supervised Learning
Supervised: Supervised learning is unique in that it has training data. The model will learn from labeled data in order to predict something, usually in the form of classification or regression.
Unsupervised: Unsupervised learning is when the algorithm attempts to create structure from unlabeled data. This is usually in the form of clustering, but can take other forms, such as learning representations of data.
Since Classical Machine Learning Algorithms are often outclassed by Deep Learning algorthims, why should we even use them? The answer is more clear than you think.
-
Simplicity. Classical Machine Learning Methods are often easier to explain and more computationally efficient that Deep Learning Based Approaches, allowing them to be deployed much easier and cheaper than their neural network-based counterparts. In addition, most classical algorithms run directly on the CPU, voiding the need for more costly GPU's.
-
Perform Better with Less Data. Classical Machine Learning algorithms don't need as much data to get good predictions, and in many cases can perform better than neural networks with limited data.
scikit-learn
Scikit-learn includes off the shelf machine learning algorithms and tools, including all of the algorithms we are using in this workshop. Scikit-learn also includes many tools that we can use in our Natural Language processing workflows, simplifying a lot of our workflows.

The Challenge
You recently got fired from you job as a data scientist from your job as because they discovered that you lied on your resume and couldn't implement linear regression from scratch. You decide to pivot and work for a newspaper, who is trying to figure out the category of each news article to deliver tailored ads. In addition, they want to create a recommender system to recommend articles to readers. How do you do this?
Click to Download Starter Code
The Dataset

The dataset that we are using is called the 20 Newsgroups Dataset which contains ~20,000 news documents spread across 20 different types of newsgroups. This dataset is made out of text documents, with each having a corresponding classification for each newsgroups, or category for each document. If given a new document, how can we predict what newsgroup it is in, and how can we find like documents as well?
| comp.graphics comp.os.ms-windows.misc comp.sys.ibm.pc.hardware comp.sys.mac.hardware comp.windows.x |
rec.autos rec.motorcycles rec.sport.baseball rec.sport.hockey |
sci.crypt sci.electronics sci.med sci.space |
| misc.forsale | talk.politics.misc talk.politics.guns talk.politics.mideast |
talk.religion.misc alt.atheism soc.religion.christian |
Classification and Clustering
To complete the above task, we can use two basic tasks in machine learning - classification and clustering.
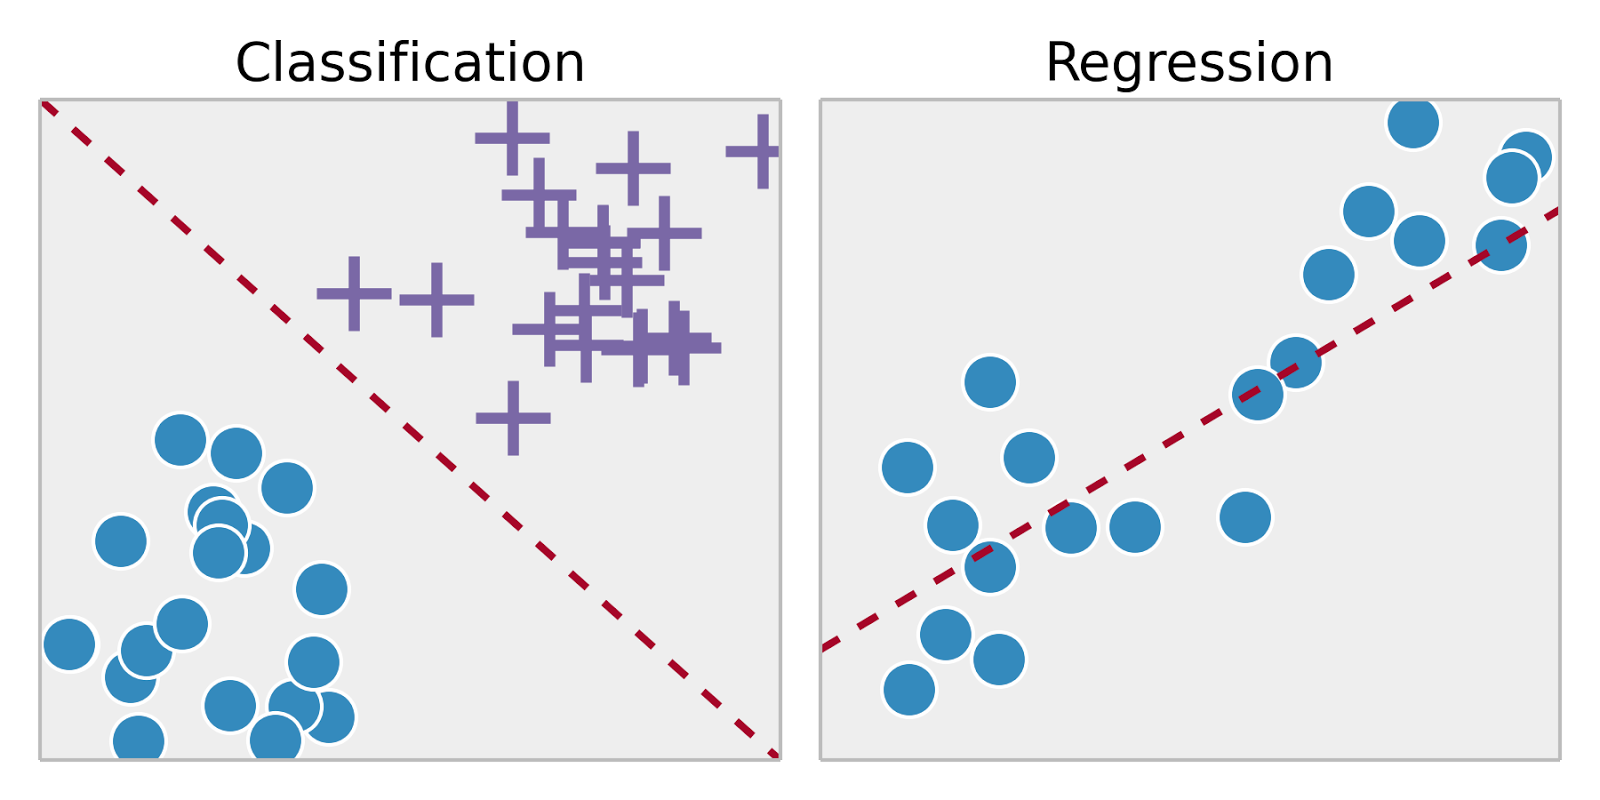
The task of classification is simple, given a new sample, how can we classify what category this sample belongs to by using past data? In the previous workshop, we used regression, which was a supervised task, in which we had training data, which our algorithm used to create a line from which we can predict continuous values. We created labels, which was a category that each corresponding sample belonged to. However, instead of predicting the value of something given a sample, we want to tell whether this sample belongs to a classification or not. In general the goal of classification is to reduce our errors, or reduce the amount of times that our model will classify a sample incorrectly.
We showed classification in the last workshop, where we classified our samples to predict whether these samples were over $200,000 or not, but in this workshop we will go a bit deeper and discuss different algorithms and methods that we can use to classify our datasets.
Clustering is a bit different. For clustering, the goal is to take data and separate them into like groups. Clustering is a mainly unsupervised task where we simply group a dataset into clusters, where the samples within each cluster are most similar to each other. We will talk later about how we can decide whether the samples in these clusters are most similar to each other, but in general, these are used to separate data and find inherent differences in data without labels.
Just as the last workshop, we can set the objective function for this task, as minimizing J_{clust}, where for each J for each cluster such that
And each J_{n}, given as
Where, G_{j} is each group, and z_{j} is each of the group representatives, for each group with index j.
Classifications and Clustering Algorithms
Support Vector Machines
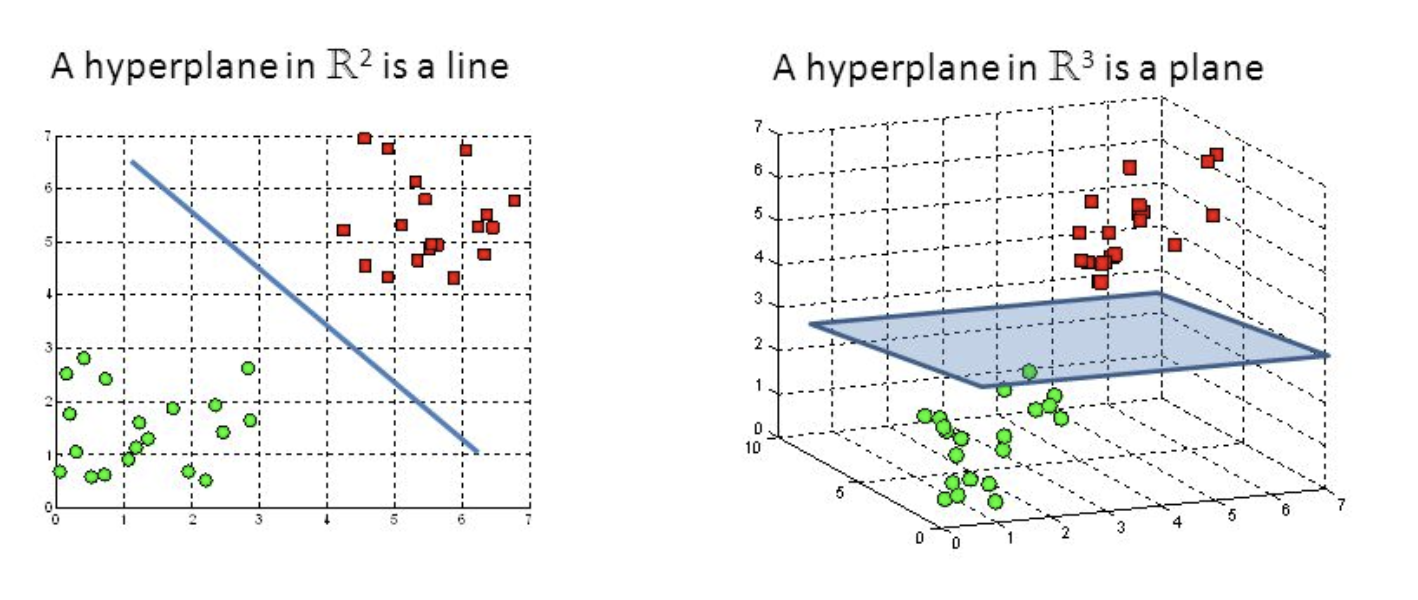
Support Vector Machine, or SVM is a relatively new, yet powerful classifier. The workings of an SVM classifier is quite simple. It tries to create a hyperplane in the data space such that it can separate this entire space, with all samples on one side of the hyperplane as one class, and the samples on the other side of this hyperplane as the other class.
To give a geometric representation, the hyperplane below can be illustrated in an \mathbb{R}^2 and \mathbb{R}^3 feature space. In \mathbb{R}^2, the hyperplane can be defined as a line, and above that a plane to denote the classification boundary in \mathbb{R}^3.
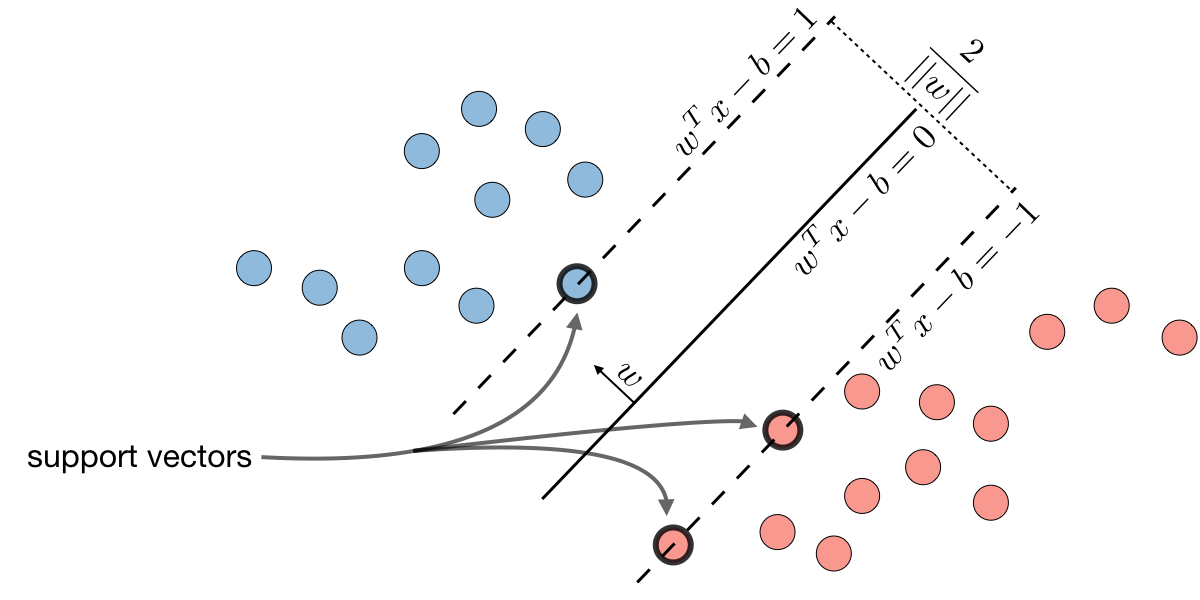
Although we won't go to deep into the theory behind how we find this hyperplane, we will go a bit into how we find this hyperplane. Support Vector Machine gets its name from the support vectors that the algorithm includes. Support vectors are the points that lie closest to the hyperplane, and are therefore the most difficult to classify. The hyperplane is defined by this very small subset of these support vectors, and we want to maximize the margin between the support vectors and the hyperplane. This is given by an analogy of maximizing the street between the support vectors on each side of the hyperplane, where the edges of the street are defined by the support vectors, and the center of the street defined as the hyperplane.
We can give the object function for the margin in that we want to maximize the margin from the hyperplane to the support vectors, where we can minimize the margin,
Info
What is the kernel trick?
This is a common question asked in many ML interviews, and is fairly useful when trying to create a proper hyperplane. Essentially, the kernel trick is transforming your data to a higher dimension in order to create a hyperplane that can linearly separate the samples. For instance, in the image below, we obviously can't create a line that can intersect these data points to separate the two classes. But we can use a symmetric function, or kernel, to transform this data.
The Radial Basis Function, or RBF, is commonly used as a kernel function in addition to Gaussian Filters as well.

KMeans
Wow, we were so into SVM classification that we almost forgot about the reccomender system. Lets try not to get that, as we definitely wouldn't want to get fired from this job as well. Let's start this problem by doing a quick case study on how recommender systems are typically implemented in industry, most notably how Netflix recommends content to its viewers.
K-Means is a powerful heuristic that we can use to cluster our datasets. K-Means works all around its cluster representatives. Clusters are defined by the centroids, or center of each cluster with each sample being added to a cluster depending on the closest centroid to that respective sample.
We can initialize kmeans by randomly selecting k points as our initial centroids, and then creating clusters based on the closest points to those centroids. We can then set the centroid to the average of all the points in the cluster, and then reiterate until the clusters do not change.
given a list of N vectors [x_1 \; \cdots \; x_N] and an initial list of k group representative vectors [z_1 \; \cdots \; z_k]
repeat until convergence:
Partition the vectors into k groups. For each vector i = 1 ... N, assign x_i to the group associated with the nearest representative.
Update representatives. For each group j = 1 .. k, set z_j to be the mean of the vectors in group j.
Faq
Question: How can you know what is a good number of clusters to split your data into?
Just like the nature of K-Means, we can actually use another heuristic to find the correct value for k, also known as the elbow method.
To do this, we can run K-means for different k-values, and plot the final J_{clust} value for each k. The graph should look like an angle with a large decrease in J_{clust} values, with the J_{clust} vlaues leveling off. This heuristic says that we should pick the k-value at the "elbow" of this angle, so we don't have too many clusters, but also not too little that our J_{clust} value is too high.
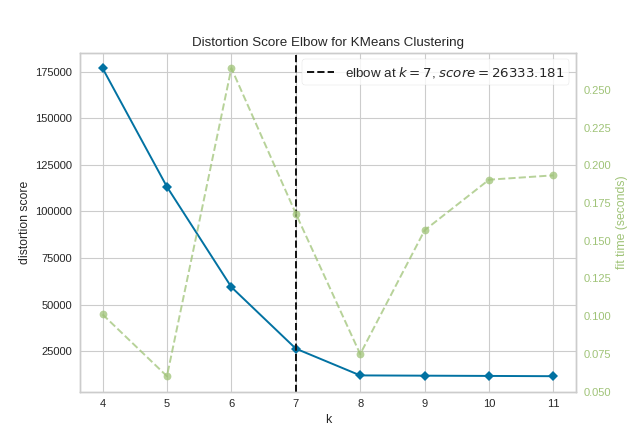
Just keep in mind that we call this a heuristic because this algorithm won't always find the most optimal J_{clust} each time we run the algorithm. Depending on how K-Means is initialized, each time we cluster our dataset we will get different clusters.
Faq
What's the difference between K-Means and K-Nearest Neighbors?
This is a pretty common question, and even a common interview question, as it's quite easy to confuse one with another, even though they really aren't similar at all. The only similarity between the two is one of the hyperparameters - K. In K-Means, k defines how many groups you want your data to be clustered into. K-Means as we have shown earlier is a clustering algorithm.
On the other had, K-Nearest Neighbors is a voting-based classification algorithm. It works by taking the the k number of samples closest to the sample you are trying to classify. Using those K samples, the unknown sample is given the classification of the class with the most labels out of those K samples.
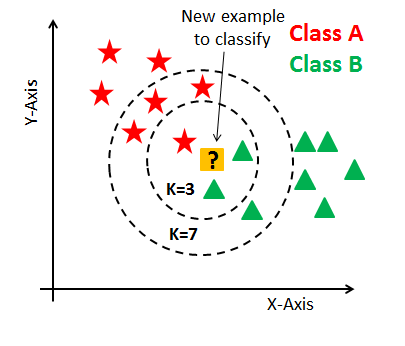
In short, K-Means is an unsupervised classification model, while K-Nearest Neighbors is a supervised classification model.
Natural Language Processing
In the past workshop, we were dealing with almost exclusively numerical data. This made things pretty easy for us. This allowed us to put these numbers into vectors, which could easily work with our machine learning algorithms. However, with text data, if you wanted to use it with machine learning, we have to answer one main question
How can we turn our text data into features that our machine learning model can use?
More specifically, how can we derive computational methods to derive meaning or get analytics from text data? Natural Language Processing is a very broad field that intersects the field of machine learning greatly, but we will be using a few NLP methods to make high performing NLP Models.
Feature Engineering and NLP
Feature Engineering is the process of making Features from our data. Making proper features is essential for any Machine Learning workflow, especially for applications of NLP.
Bag of Words
One popular way to create proper features for NLP applications is by using the Bag of Words representation of text data. In bag of words, the order of words and grammar is unimportant, as we only care about the amount of times a words has appeared in a certain text.
When using bag of words, a matrix would be created with every row is a specific word with the columns being the count of the word or other measurement. Essentially, the array is made of "bins" where each measurement is stored. For example, if we wanted to do a bag of words model with counts on this corpus (a corpus is essentially your full collection or dataset of text)
-
This is the first document
-
This document is the second document
-
And this is the third one.
-
Is this the first document?
Your final bag of words representation using counts, or your Count Vectorizer, would look like this:
| and | document | first | is | one | second | the | third | this |
|---|---|---|---|---|---|---|---|---|
| 0 | 1 | 1 | 1 | 0 | 0 | 1 | 0 | 1 |
| 0 | 2 | 0 | 1 | 0 | 1 | 1 | 0 | 1 |
| 1 | 0 | 0 | 1 | 1 | 0 | 1 | 1 | 1 |
| 0 | 1 | 1 | 1 | 0 | 0 | 1 | 0 | 1 |
Note
You might think that when using the bag of words representation, you will be removing a lot of contextual and grammatical data about text. This is true, but for many large scale text applications such as the one we are doing here, specific grammar and other traits of sentences are irrelevant. For example, if you wanted to make your own version of the UCSD Spam Quarantine, you might find that many emails labeled as spam, would likely have very high frequency of certain words, likely "buy", "free", or other similar words.
On the other hand, grammar might not be as important to the classification as certain words may be. However, this does not mean that not creating features from grammar is a bad idea, as it is very important in many subsections of NLP such as sentiment analysis and speech translation.
TF-IDF
On the other hand, using a count vectorizer isn't always the best method of creating a bag of words representation for your text. For example, what if one of your text samples is much longer than others which is the case for many datasets? Obviously the counts would be higher, but these words with higher counts would be weighed higher in your model, therefore causing this specific sample to skew your model. We can alter the count vectorization method by instead using a frequency method, where your bag of words representation is based on proportions instead of raw counts.
The most common way to do this is through using term frequency - inverse document frequency method, or TF-IDF.
Your term frequency can be calculated as:
$$TF(t) = \text{(# of times word t appears in a document) / (Total # of words in the document)} $$
IDF calculated as:
$$ IDF(t) = \text{log(Total # of documents / # of documents with word t in it)} $$
And you final TF-IDF for each word calculated as:
Info
Occam's razor
You may have heard Occam's Razor before, which can be paraphrased as "The simplest solution is most likely the right one." This saying can be true in any discipline in engineering, and is especially true with machine learning models. Higher complexity and unneeded features can cause your model to perform, worse, as yur model can start to weigh in these unnecessary features. Additional complexity to machine learning models also adds extra computational cost, meaning higher actual cost when your models are deployed. This reason is why data cleaning and reducing features is necessary to create well performing ML models.

Always try to cut out complexity from your model
NLP with sklearn
Loading Data
This part of the workshop is pretty easy compared to the last time in terms of importing data (last time was easy too, but this is even easier 😊).
sklearn includes some nice functions to load this dataset. Simply put, we can use the below functions to import the dataset and filter out extraneous data, such as the article headers and footers. After that, make sure to load this data into a dataframe to make use of the nice filtering functions in pandas.
1 2 | from sklearn.datasets import fetch_20newsgroups newsgroups = fetch_20newsgroups(subset='all',remove = ('headers', 'footers', 'quotes')) |
Data Cleaning
In addition, when creating features from text, there may likely be words that add little to nothing to the meaning of a text, for example words like "for", "and", "the", or "a". We can remove these stopwords from our text to help clean our text from such useless features that can add to the complexity of our model. One library that we can use for this is nltk, which stands for Natural Language Toolkit
We first have to download these stopwords, but with a bit of tricky use of the df.apply and lambda functions, we can remove these stop words from our data.
1 | Dataframe.str.replace() |
In addition, for a lot of our text data, we want to remove extraneous symbols and other things that could affect our features.
Feature Creation
Now that we have removed unwanted text, let's now create features from our text data set. As explained earlier, we can use the bag of words representation with TF-IDF to create features that are independent of text size. This is done easily through TfidfVectorizer() in the sklearn.feature_extraction.text module.
-
CS 229: Kernels https://see.stanford.edu/Course/CS229/39 ↩
-
Wikipedia: Kernel (Statistics)https://en.wikipedia.org/wiki/Kernel_(statistics) ↩